Ham Dashboard User Documentation
The Ham Dashboard is a comprehensive, real-time dashboard designed for radio amateurs. It provides a centralized view of station information, propagation conditions, space weather, DX spots, and more. One of its most powerful features is the Visual Layout Builder, which allows you to customize exactly how your dashboard looks.
Table of Contents
- Getting Started
- Station Console
- Settings & Customization
- Visual Layout Builder
- Core Modules
- Feedback & Notifications
- Changelog
Getting Started
When you first load the Ham Dashboard, you will see the primary dashboard. If you are not logged in, the application runs in Demo Mode, displaying data for a default station location (typically Homer, Alaska).
- Login: Use the login link at the bottom of the Station Info pane to access your personalized settings.
- Fullscreen: Click the "Expand" icon in the upper-left corner of the dashboard to enter dedicated fullscreen mode. This is perfect for dedicated shack monitors or secondary displays. The dashboard is designed for continuous operation and will automatically "soft-refresh" every 6 hours to ensure stability while maintaining your fullscreen state.
- Session Persistence: Your login session is configured to last for 30 days, so you won't be unexpectedly logged out of your dedicated dashboard display.
- Kiosk Mode (Station Key): For dedicated shack monitors or dashboards where you want to ensure the display stays logged in permanently even if the browser reboots or clears cookies, you can use a Kiosk URL. This URL contains a unique secret key that automatically authenticates your station. You can find and manage your Kiosk URL in the Station Settings.
Station Console
The Station Console is the central management hub for your account. It provides an overview of system health and quick access to management tools.
- System Stats: View real-time statistics about users, feedback, and system activity.
- Management Links: Quick access to User management, Feedback moderation, and System settings.
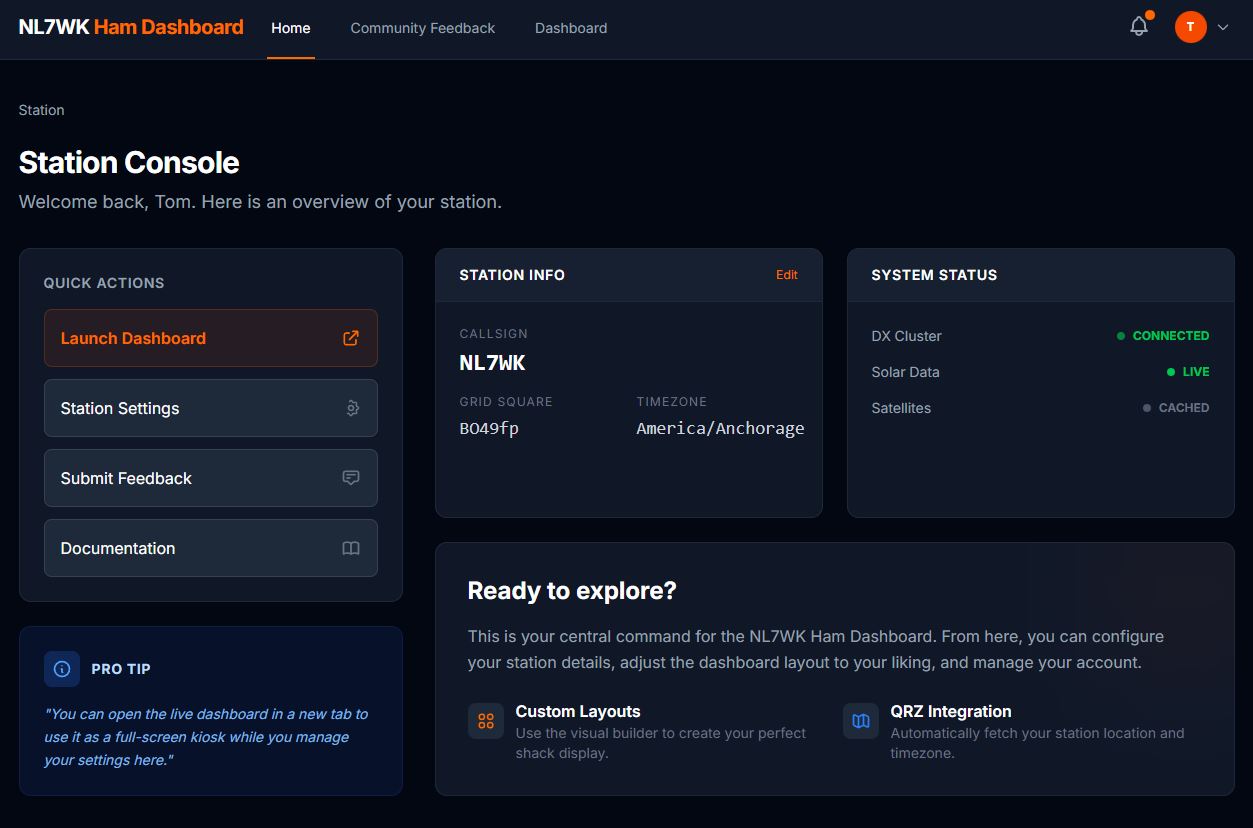 Figure 1: The Station Console provides a high-level overview of the application state.
Settings & Customization
Station Configuration
Access via Settings > Station.
- Callsign Lookup: Enter your callsign and click "Get location from QRZ" to automatically populate your Latitude, Longitude, and Timezone.
- Location Picker: You can also manually click on the interactive map to set your station coordinates precisely.
- Active Sessions: Manage your account's active logins across different devices and browsers via Settings > Active Sessions. You can see the IP address and device information for each session and remotely log out of other devices if needed.
- DX Spot Limits: Set the maximum number of spots to show on the dashboard and how many hours back to look.
- Compact Spotter Markers: Toggle this setting to replace large callsign labels for spotters on the map with a simple dot, reducing map clutter.
- Pressure Units: Choose how you prefer to view barometric data. You can select hPa (commonly referred to as millibars in many regions) or inHg (inches of mercury), which is the standard unit used in United States aviation and weather reporting.
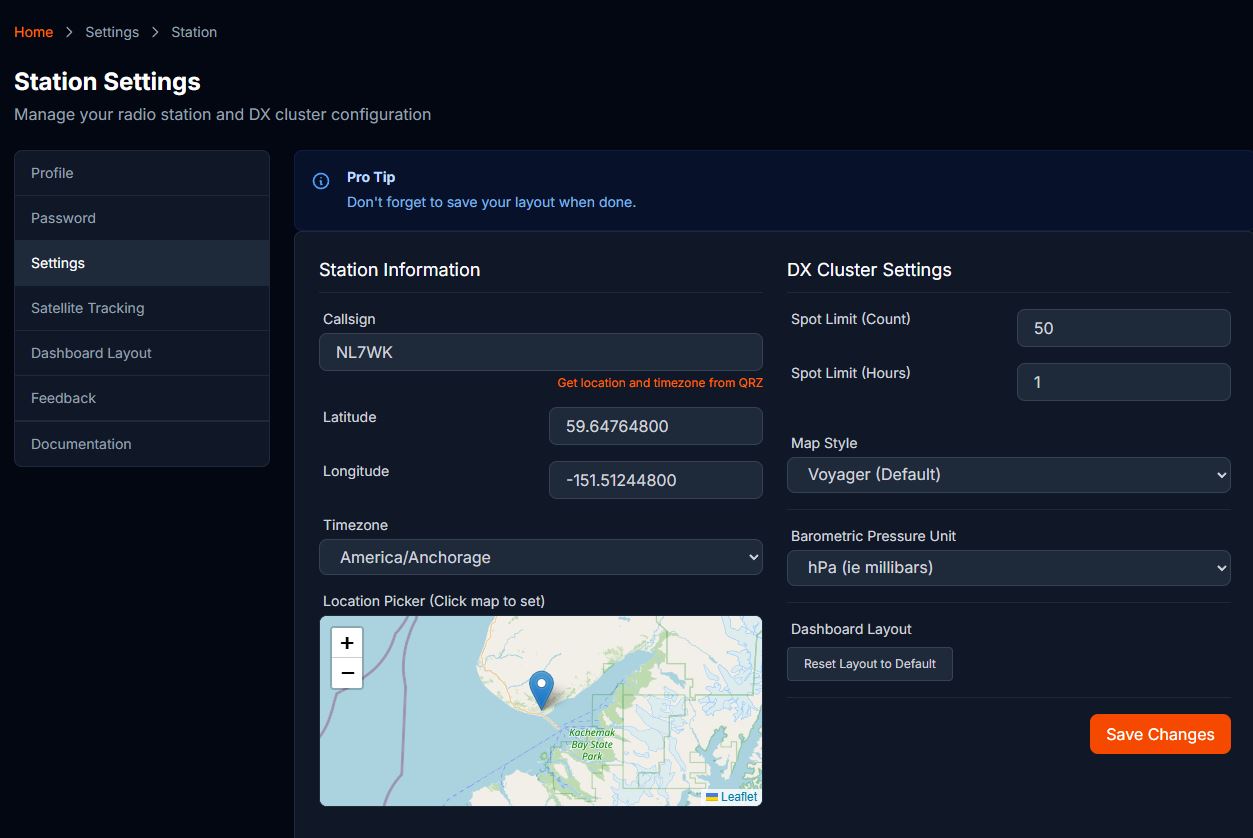 Figure 2: Configuring station location and units.
Map Styles
Choose from various basemaps to suit your shack's aesthetic or functional needs:
- Voyager: A clean, high-contrast map with a modern aesthetic.
- Dark Matter: A dark-themed map that reduces glare in low-light environments.
- Light Positron: A bright, minimalist map for high-visibility.
- OpenStreetMap (OSM): Standard community-driven geographic map.
- Satellite: High-resolution imagery of the Earth.
- Terrain/Topo: Visualizes elevation and physical geography.
Satellite Tracking
Configure which satellites to track on the World Map via Settings > Satellites.
- Selection: Choose satellites from the list (e.g., AO-91, ISS).
- Map Visibility: There is a "Show on map" checkbox that allows you to toggle the entire satellite overlay without removing your selections.
- Opacity: Use the Opacity slider to adjust how prominent the satellite footprints (coverage areas) appear on the map. A lower opacity keeps the map clear, while a higher opacity makes it easier to see exact coverage.
- Minimum Elevation: The Minimum Elevation setting (0-90°) allows you to filter satellites based on their height above your horizon.
- On the Map: Satellites below your minimum elevation will be dimmed, and their footprint and orbital path will be hidden to reduce clutter. The footprint on the map is also adjusted to show the area where the satellite is above your specified minimum elevation.
- In the Satellite Monitor: Predicted passes will only be shown if the satellite's maximum elevation for that pass exceeds your minimum threshold.
- Display: The map will show the current position, orbital path, and footprint for each selected satellite.
![]() Figure 3: Managing satellite tracking, overlay opacity, and minimum elevation.
Figure 3: Managing satellite tracking, overlay opacity, and minimum elevation.
Active Sessions
Monitor and manage your active login sessions via Settings > Active Sessions.
- View Active Devices: See a list of all devices currently logged into your account, including their IP address, browser information, and last active time.
- Remote Logout: If you suspect an unauthorized login or simply want to clean up old sessions, you can log out individual devices or use the "Log Out Other Sessions" button to sign out of all devices except the one you are currently using.
- Persistence: This feature is particularly useful for dashboards running on dedicated tablets or monitors to ensure they remain active and secure.
Dashboard Layout
The dashboard is organized into rows:
- Top Row: Typically contains high-level station, weather, and propagation overview.
- Main Row: Contains the World Map and high-traffic data feeds like the DX Cluster.
Each row consists of one or more Slots (columns). Each slot can contain one or multiple Modules (panes like DX Cluster, Weather, etc.).
On-Screen Keyboard
The Ham Dashboard includes a built-in On-Screen Keyboard (OSK) designed specifically for touchscreens or mouse-only operation (e.g., when the dashboard is running on a dedicated Raspberry Pi or tablet).
- How to Enable:
- Before Login: Look for the "Enable On-Screen Keyboard" button at the bottom of the Login or Forgot Password pages.
- After Login: Use the Keyboard icon at the bottom of the sidebar navigation.
- Dynamic Layouts: The keyboard intelligently switches between an ABC (QWERTY) layout for text fields and a 123 (Numeric) pad for frequency or coordinate inputs.
- Smart Focus: When enabled, the keyboard automatically appears whenever you focus an input field. It also suppresses the OS-level virtual keyboard (on mobile/tablet) to prevent UI overlapping.
- Session Based: This is a session-based preference. It stays active while you are using that specific device, but won't interfere when you log in from a desktop PC with a physical keyboard.
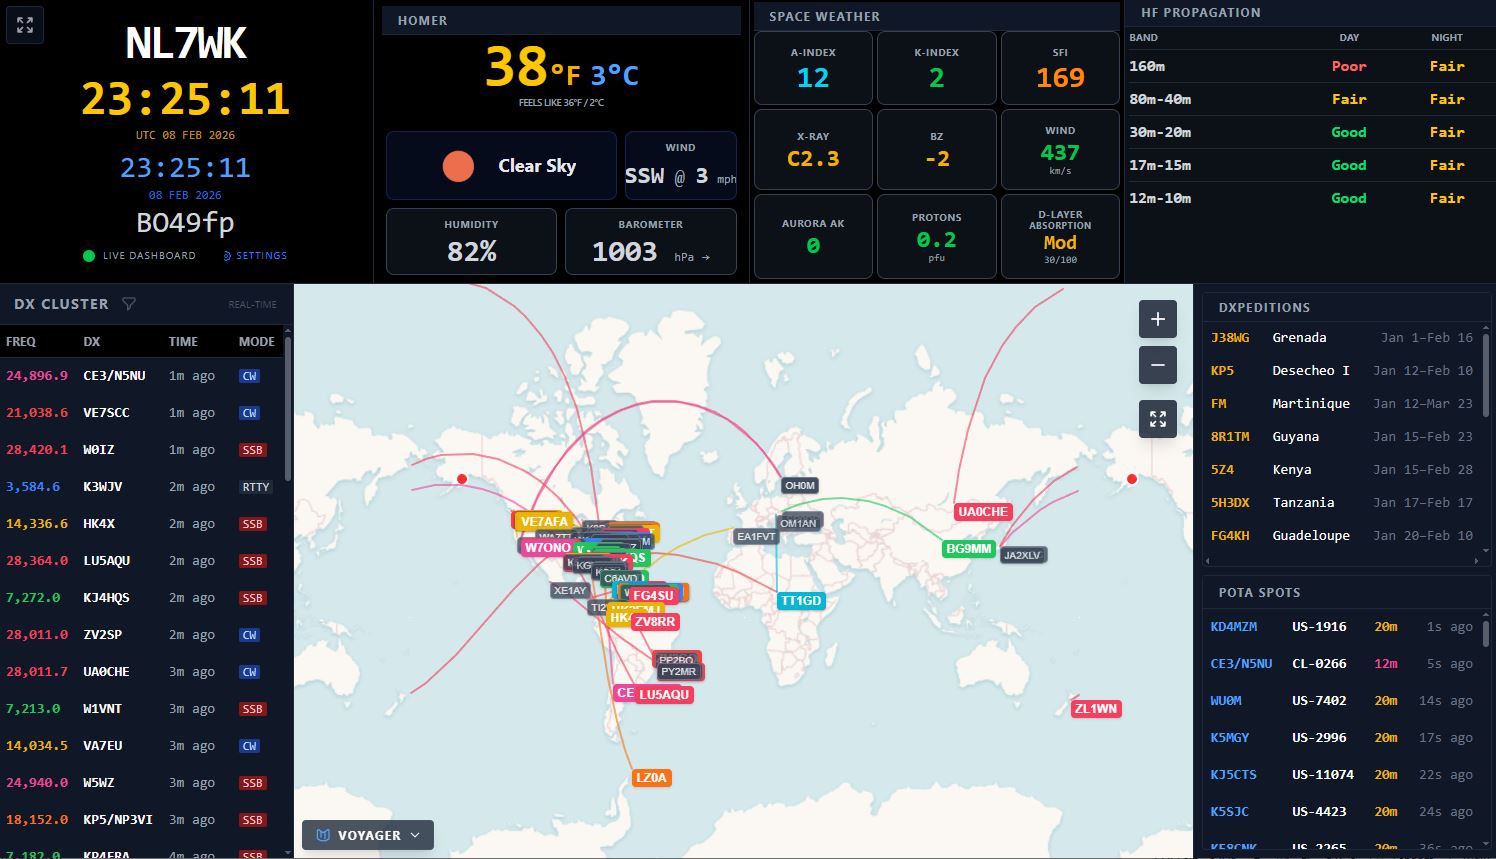 Figure 4: Typical dashboard layout with station info, weather, map, and DX cluster.
Visual Layout Builder
The Visual Layout Builder is the most advanced customization tool in the Ham Dashboard. It is accessible via Settings > Dashboard Layout.
Collapsible Sidebar
To maximize screen real estate, the application features a collapsible navigation sidebar.
- Toggle: Click the "Chevron" icon at the top of the sidebar to collapse or expand it.
- Auto-Hide: On mobile devices, the sidebar remains hidden until toggled to provide more space for the dashboard.
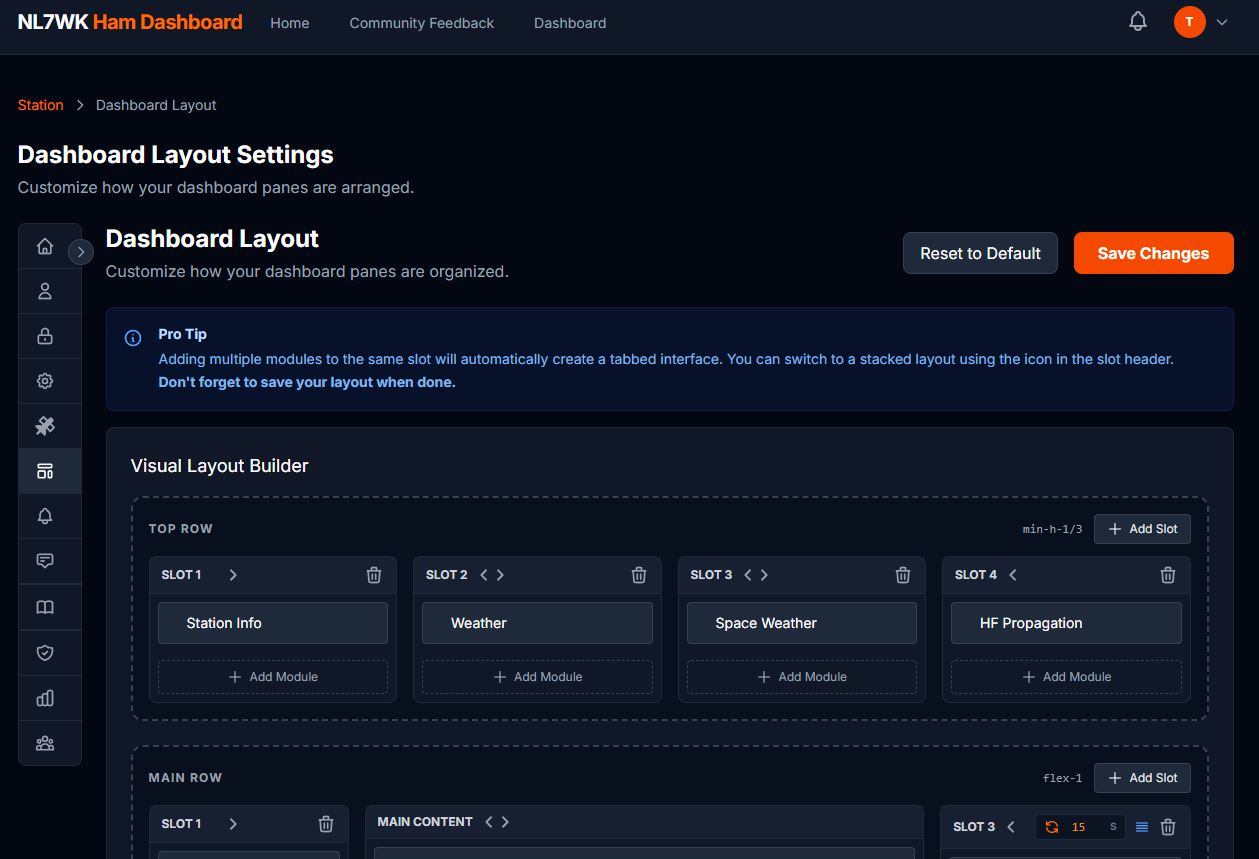 Figure 5: The collapsible sidebar in collapsed state.
Managing Slots (Columns)
Slots define the horizontal partitions within a row.
- Add Slot: Click the "Add Slot" button in a row's header to create a new column.
- Move Slot: Use the Left/Right arrow icons in the slot header to change its horizontal position.
- Remove Slot: Click the Trash icon to delete a slot. Note that the "Main Content" slot in the Main Row cannot be removed.
Managing Modules
Each slot can host multiple modules.
- Add Module: Click "Add Module" at the bottom of any slot and select from the available list. A module can only be placed once on the dashboard.
- Reorder Modules: Use the Up/Down arrows next to a module's name to change its priority within the slot.
- Remove Module: Hover over a module and click the "X" to remove it from that slot.
Display Styles: Tabbed vs. Stacked
When a slot contains more than one module, you can choose how they are displayed:
- Tabbed (Default): Modules appear as tabs at the top of the pane. Users can manually switch between them, or they can auto-rotate. This is ideal for saving vertical space.
- Stacked: Modules are displayed one on top of the other, separated by a gap. This is useful if you want to see multiple data feeds simultaneously in the same column.
- Toggle: Click the "Stack/Tab" icon in the slot header to switch between these modes.
Auto-Rotation
In Tabbed mode, you can enable auto-rotation so the dashboard cycles through the modules automatically.
- Enable/Disable: Click the "Refresh/Rotate" icon in the slot header.
- Timing: When enabled, you can specify exactly how long each module stays on screen. Enter the number of seconds (e.g.,
15) in the timer box that appears.
Resetting the Layout
If you want to return to the original Ham Dashboard configuration:
- Go to the Layout Builder.
- Click Reset to Default at the top of the page.
- Confirm the reset. Your layout will be cleared, and the system default will be applied.
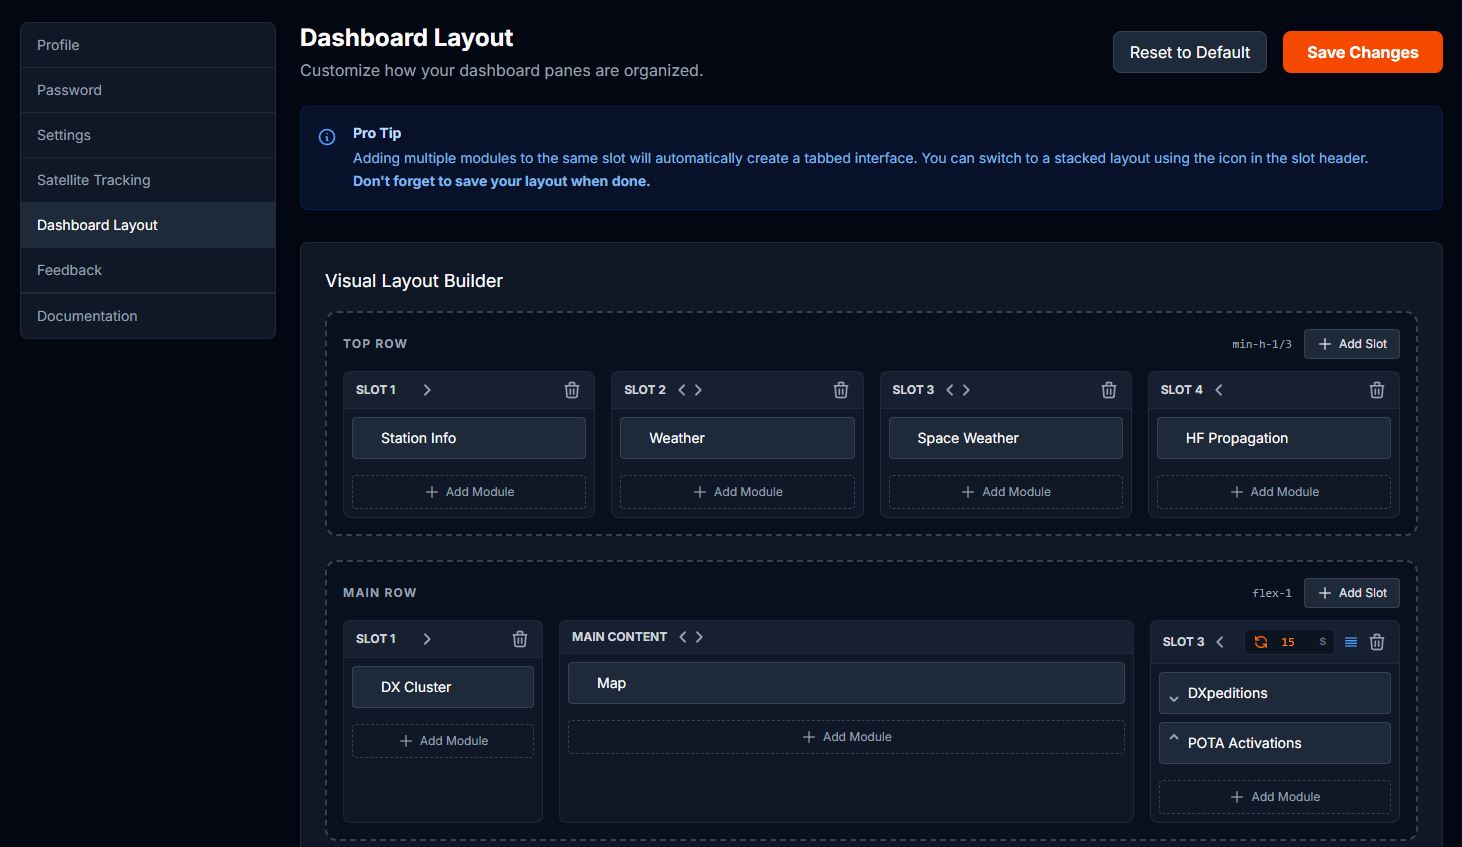 Figure 6: The Visual Layout Builder showing row and slot management.
Core Modules
Station Information
Displays your callsign, UTC time, Local time, and Maidenhead Grid Square.
- Data Source: Time is derived from your system clock and adjusted based on your configured timezone. The Grid Square is calculated automatically from your station coordinates.
- Visual Aid: A pulsing green "Live" indicator confirms that the dashboard is actively receiving real-time updates.
World Map & Grayline
A fully interactive Leaflet-based map.
- Grayline: Real-time day/night terminator visualization.
- DX Spots: Mapped connections between spotters and DX stations.
- Satellite Footprints: Live tracking of amateur radio satellites. Satellites and their coverage areas can be filtered based on a configurable minimum elevation threshold.
- Controls: Use the upper-right buttons to zoom or "fit" the map to a global view. Use the bottom-left menu to switch map styles.
DX Cluster
The heartbeat of the dashboard, showing the latest spots from around the world.
- Data Source: Aggregated real-time telnet cluster feeds and API integrations.
- Filtering: Click the "Filter" icon (looks like a funnel) next to the title to restrict spots by band, mode (CW, FT8, SSB), or continent.
- Detail View: Clicking any spot in the list opens a detailed modal with country info, beam headings, and distance.
Space Weather & Storm Watch
Provides critical solar indices and real-time alerts for space weather events.
- Data Source: Real-time feeds from NOAA SWPC and HamQSL.
- SFI (Solar Flux Index): Indicates solar activity levels.
- K-Index & A-Index: Measures geomagnetic stability.
- Solar Wind & Bz: Crucial for predicting aurora and polar path openings.
- Storm Watch: A specialized alert system that monitors NOAA G (Geomagnetic), S (Solar Radiation), and R (Radio Blackout) scales. The module turns bright red and pulses when any scale is above 0.
- Trends: 3-hour trend arrows for SFI, Sunspot Number, and Kp index help you see where conditions are heading.
VHF Conditions (Aurora & E-Skip)
A specialized module for VHF/UHF operators.
- Data Source: Calculated conditions from the HamQSL (N0NBH) feed.
- Aurora Status: Real-time status for VHF Aurora openings.
- E-Skip (Sporadic E): Monitors Sporadic E openings for North America and Europe, providing early warnings for band openings on 6m, 4m, and 2m.
Contest Calendar
Keep track of upcoming amateur radio contests.
- Data Source: Synchronized daily from the WA7BNM Contest Calendar.
- Overview: Displays upcoming contests with their name, mode, and date range.
- Detail View: Clicking a contest opens a modal with full details, including frequency bands, exchange information, and a link to the official rules.
HF Propagation
A summary table showing predicted band conditions for both Day and Night paths.
- Data Source: Calculated based on current solar indices and propagation models.
- Readings: Conditions range from "Poor" (Red) to "Fair" (Yellow) to "Good" (Green).
Weather
Local weather for your station location.
- Data Source: OpenWeatherMap API, tailored to your exact Latitude and Longitude.
- Display: Includes temperature, humidity, barometric pressure (with trend arrows), and wind speed/direction.
POTA & SOTA Activations
Real-time feeds for Parks on the Air and Summits on the Air activations.
- Data Source: Live feeds from pota.app and sota.org.uk.
- Band Filtering: You can customize which bands you want to see in the POTA and SOTA modules via the "Filter" icon in the module header. This allows you to focus only on the bands you are currently monitoring.
DXpeditions
Stay informed about major international DX operations.
- Data Source: Synced daily from the NG3K ADXO plain text feed, showing active and upcoming expeditions.
- Grouped Display: When the same callsign has multiple date ranges, only the nearest expedition is shown to eliminate visual duplicates.
- Status Indicators: Color-coded dots indicate expedition status — 🟢 Active (on the air now) and 🟡 Upcoming (scheduled for the future).
- Detail Modal: Click any DXpedition to open a detail modal with:
- Status Badge: Shows Active, Upcoming, or Recently Ended with a countdown (days remaining or days until start).
- Date Range: Full start and end dates for the expedition.
- Expedition Info: Bands, modes, QSL details, and operator information when available.
- Recent Cluster Spots: Cross-referenced from your live DX Cluster feed, showing recent frequencies and modes the expedition has been spotted on.
- Distance & Bearing: Geodesic distance (km/mi) and bearing (short path/long path) from your station, when DXCC coordinates are available.
- External Links: Quick-launch buttons for QRZ.com (callsign lookup), DX World (expedition news and details), and DXHeat (live cluster spots).
Dashboard Persistence
The Ham Dashboard is optimized for "always-on" displays such as dedicated shack monitors or tablets.
- Soft-Refresh: To prevent browser memory leaks or "tiredness" after days of continuous operation, the dashboard automatically performs a background soft-refresh of its components every 6 hours.
- Fullscreen Protection: Unlike a standard browser refresh, this soft-refresh preserves your Fullscreen state, so you don't have to manually re-enable it.
- Heartbeat System: An invisible heartbeat runs every 5 minutes to keep your session alive and ensure that real-time notifications are delivered promptly.
Feedback & Notifications
Submitting Feedback
We value your input! The Public Feedback area allows you to submit bug reports and feature requests.
- Voting: You can upvote or downvote feedback items from other users to help prioritize development.
- Comments: Join the discussion by adding comments to any feedback item.
- Filtering: Use the filters at the top of the feedback list to view specific types (Bugs vs. Feature Requests) or statuses (Approved, Planned, In Progress, Completed).
Notifications
Stay updated on station events and system alerts via the notification system.
- Dashboard Alerts: Unread notifications are displayed prominently in the Station Information module.
- Notification Dropdown: Click the Bell icon in the header to view recent notifications, mark them as read, or view the full notification history.
Changelog
You can view the full development history and list of recent changes by visiting the Changelog. This page provides a detailed list of all updates, bug fixes, and new features added to the Ham Dashboard, organized by date and version.